How green are green and blue hydrogen?
By Cedric Philibert on October 07, 2021
A guest article by Cedric Philibert
Howarth and Jacobson
Although it appeared in the middle of August, the study did not go unnoticed. Robert Howarth and Mark Jacobson, respectively from Cornell and Stanford Universities, published “How green is blue hydrogen”, an examination of the lifecycle greenhouse gas emissions (GHG) of blue hydrogen, i.e., hydrogen from steam methane reforming with carbon dioxide capture and storage (CCS).
Their conclusions? For their default assumptions, total carbon dioxide equivalent emissions for blue hydrogen are “only 9%-12% less than for gray hydrogen”, lower carbon dioxide emissions being almost fully compensated by increased fugitive methane emissions. Furthermore, the greenhouse footprint of blue hydrogen is “more than 20% greater than burning natural gas or coal for heat, and 60% greater than burning diesel oil for heat.” The authors add that their study, published in the peer-reviewed journal Energy Science & Engineering, assumes that captured carbon dioxide can be stored indefinitely, although this is an “optimistic and unproven assumption”.
Reviewing the assumptions
However, most other assumptions made in that study are disputable. Contrary to the authors’ conclusions, blue hydrogen (and therefore blue ammonia) can, under some conditions, bring about a valuable contribution to climate change mitigation. Let us review three of these assumptions before discussing the possible value of blue hydrogen.
1. Howarth and Jacobson assume capture efficiencies of 85% of the CO2 produced in the steam methane reformers (SMR), and 65% of the CO2 resulting from the combustion of natural gas delivering the required energy to the process (a more diluted CO2 flux). Further, they assume that the electricity necessary for the capture of CO2 – an estimated 25% “energy penalty” – is produced with “no effort to capture the carbon dioxide from the fuel (natural gas or coal) burned to generate this electricity”.
While these estimates are rooted in data from a couple of existing facilities that commercially produce blue hydrogen in 2021, future plants are expected to achieve much better performance and capture 90% of total CO2 produced in both process and energy fluxes.
The International Energy Agency (IEA) notes that capture rates could be even higher with autothermal reformers (ATR) or combined ATR/SMR – a combination gaining market share in new installations. Taking as a given the relatively poor performance of the very first installations is like having considered, at the onset of photovoltaics, 12% as the unsurpassable efficiency of PV modules.
2. The emissions of methane due to venting or leaks during the production, transport and use of natural gas, as a feedstock and an energy source in blue hydrogen production (including the capture process), play a major role in Howard and Jacobson’s results. To estimate these emissions, they use “top-down” emission studies that employ information from satellites or airplane flyovers and calculate an “upstream” emission factor of 3.5% of the natural gas consumed.
This is probably excessive. Assigning emissions to precise sources using top-down methods is very difficult. Methane emissions from agriculture are greater than those from the use of natural gas. The IEA assesses methane emissions from natural gas at just over 1.7% as a global average. The rate might be significantly higher in some countries, lower in others. In a forthcoming paper On the climate impacts of blue hydrogen production (Bauer et al.), scientists from a dozen labs note that emissions from supply chains vary significantly around the world.
Furthermore, this estimate includes upstream and downstream emissions, the latter counting for 0.4% – “downstream” being defined as the low-pressure distribution and end-use levels of the natural gas grid. Large consumers such as steam methane reformers are fed with high-pressure pipelines which are less prone to leaks. Finally, a significant share of methane emissions, including from the exploitation fields, could be suppressed or reduced if the right policies are implemented. The IEA has identified dozens of opportunities for reducing methane leaks, stating that 40-50% reduction could be obtained at no net costs, the value of captured methane being higher than the abatement cost.
3. The authors use for methane a 20-year global warming potential (GWP) of 86, that is, 1 g CH4 is considered equivalent to 86 g CO2. According to the IPCC Sixth Assessment Report, The Physical Science Basis, the 100-year GWP of fossil methane is 29.8. To justify their choice of a 20-year time horizon, Howarth and Jacobson argue that the usual choice of 100-y GWPs “underestimates the role of methane in global warming over shorter time periods”; and that an “increasing number of scientists have called for using a 20-year time period instead of or in addition to the 100-year period”; hence “a 20-year period is more appropriate than a 100-year time frame given the urgency of reducing methane emissions over the coming decade”.
However, the way a 100-year time horizon may “underestimate” the short-term effect of methane is fundamentally different from the way a 20-year time horizon surely underestimates the long-term effects of carbon dioxide in the atmosphere.
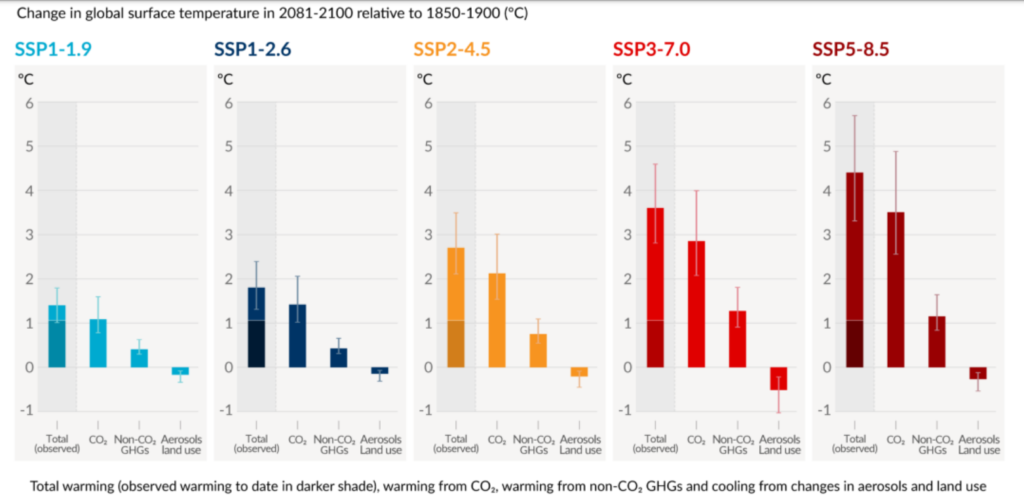
GWPs relate the climate forcing of a pulse emission of a given greenhouse gas (GHG) to that of CO2 over the designated time horizon: they are ratios of integrals, not ratios of endpoints[1]. The 100-year GWP takes almost full account of all CH4 effects (with the notable exception of climate feedbacks), while the 20-year GWP fully ignores the long-lasting radiative forcing of CO2 beyond the first 20 years, which represents over half of its total effects on climate change. As CO2 is the most important GHG (see figure below) in all IPCC-considered scenarios, it still makes sense to choose a time horizon that takes into account the long persistence of CO2 in the atmosphere more than the short half-life (12 years) of methane.
A recent study by a group of scientist suggests that the “ideal” time horizons from an economic standpoint, the ones that keep the total abatement costs the lowest, range from 58 to 110 years depending on the pathway considered. Hence, they state that 100-y GWP “appears to be a reasonably good approximation of cost-effective metrics for the next few decades.”

The 100-year GWP has been the constant choice of all the nations in the United Nations Framework on Climate Change, from its 1st Conference of the Parties (COP) in 1995 to its 24th COP and the Paris Agreement Rulebook in 2018. If there is no absolute truth relative to the “right” time horizon, it makes little sense to hand pick different ones for different gases or different applications. With a sufficiently short time horizon (in days), the GWP of burning coal is negative, especially without scrubbers, as aerosols have a cooling effect.
GHG footprint of hydrogen production: impact of changing the assumptions
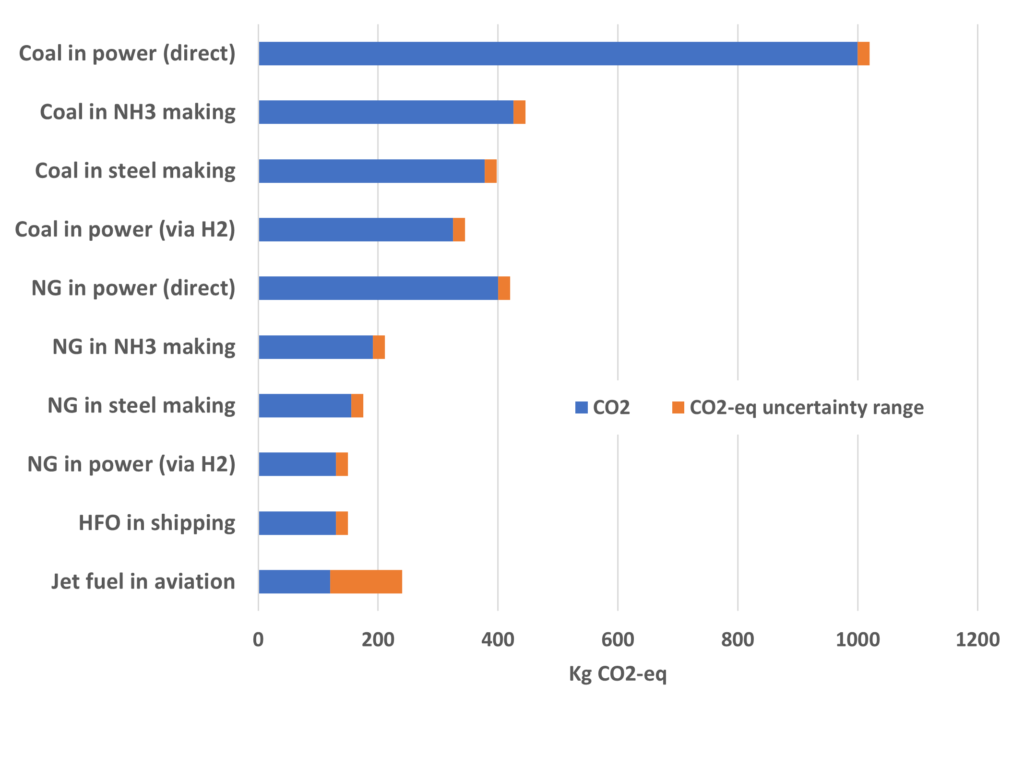
The GHG footprint of hydrogen production is consequential since 6% of all the natural gas extracted (and 2% of the coal) is used for this purpose. The key assertion made in Howarth and Jacobson’s paper is that the GHG footprint of blue hydrogen is almost as heavy as that of gray hydrogen. As shown in the table below, the authors’ 135 g CO2eq/MJ for blue hydrogen is only 12% less than the 153 g CO2eq/MJ for gray hydrogen. Moreover, the GHG footprint of blue hydrogen, if it were to be used directly as a source of heat, would be heavier than that of natural gas (111 g CO2eq/MJ) – in spite of all the effort involved in capturing the CO2 flux.
| Natural gas direct use (heat) | Gray H2 (SMR) | Blue H2 (gray+CCS) | eSMR | eSMR+CCS (eBlue) | ||
|---|---|---|---|---|---|---|
| Howarth & Jacobson | g CO2-eq/MJ | |||||
| Reduction from gray H2 | ||||||
| This author | g CO2-eq/MJ | |||||
| Reduction from gray H2 |
However, the picture changes significantly if we assume upstream methane leaks are only 1.3%; the CO2 capture rate is 90%; and we use the 100-year GWP of 29.8. In this case, the GHG footprint of blue hydrogen falls to 27 g CO2eq/MJ, 68% better than the 86 g CO2eq/MJ of gray hydrogen calculated with these assumptions (and 56% better than the 61 g CO2eq/MJ of natural gas combustion).
Howarth and Jacobson go on to ask if there might be “a path for truly ‘green’ blue hydrogen.” The specific scenario they examine uses green electricity as the source of process energy in the SMR reactor (“eSMR + CCS”). As noted in the table above, Howarth and Jacobson calculate total emissions for this case as 52 g CO2eq/MJ. They note that this would still be 47% of the emissions for burning natural gas directly but fail to note that it would be a 66% reduction vs. gray hydrogen.
If we use instead the assumptions detailed above for methane leaks and GWP, total emissions would be only 12 g CO2eq/MJ – an 80% reduction with respect to direct use of natural gas, and an 86% reduction vs. gray hydrogen. Green electrification alone without CO2 capture (eSMR), would lead to emissions of 47 gCO2/MJ – a reduction of 45% vs. gray hydrogen and 23% vs. direct use of natural gas.
In the light cast by these figures, the case for blue over gray hydrogen cannot be lightly dismissed. But given that green hydrogen from water electrolysis run fully on renewable (or nuclear) electricity, would have a GHG footprint close to zero, why should we bother with blue hydrogen at all?
A path for truly ‘green’ blue hydrogen

The IEA shows the need to quadruple the pace of solar and wind deployment in the next ten years. In Europe, the USA, China, and many other countries one and perhaps even two decades of accelerating deployment will not bring the power systems to the brink of full decarbonisation. Furthermore, the global economy will need significantly more electricity than today, despite energy efficiency improvements and behaviour changes, to replace fossil fuels in buildings, industry, and the transport sector. The variability of sunshine and wind and some mismatches with power demand will appear progressively, creating surpluses of green electricity which may not find a better use than feeding flexible electrolysers. And some hydrogen-based feedstocks and fuels, ammonia in the first place, could be produced and exported from areas with bountiful resources. However, during these years, using large amounts of green electricity to produce green hydrogen would have a high “GHG opportunity cost”, in that green electricity could be better used to displace fossil fuels in power production and a variety of other end uses than for hydrogen production. These considerations clearly point to a role for blue hydrogen as a transitional fuel, especially since the oil and gas industry will be able to deliver based on its assets and skills. (Note that If SMRs are electrified, they would consume about five times less green electricity than electrolysers per unit of “green blue” hydrogen[2] produced, thus forming an interesting combination of green power and natural gas.)
A case could even be made for broader uses of low-carbon hydrogen thanks to blue hydrogen. If you have some green electricity to satisfy a given need directly rather than with using hydrogen, you should do so if it is technically feasible. On the other hand, if you do not have enough green electricity – yet – then using blue hydrogen for some time may be the only short term alternative to using fossil fuels.
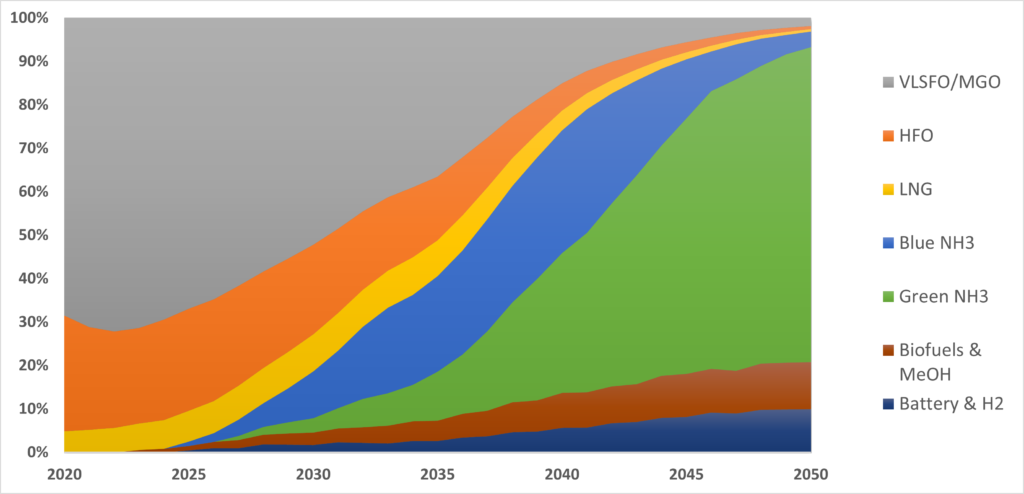
The case for casting blue hydrogen in a significant but transitory role can be seen vividly in the maritime sector. Besides energy efficiency improvements and wind assistance, the full decarbonisation of the sector by 2040 could be accomplished with 3600 TWh of energy from low-carbon ammonia. If this were to be produced exclusively from green electricity, the gross energy required would amount to some 6500 TWh with current electrolysers and Haber-Bosch technologies. This represents 25% of global electricity generation, and 3.5 times the global solar and wind generation, in 2018. And this does not include decarbonising ammonia in its current uses. It is thus easier to envision meeting mid-term maritime decarbonisation goals if blue hydrogen is in the mix than if the task must be accomplished exclusively with green hydrogen.
[1] That would be the case of the Global Temperature change Potential (GTP), another metrics set forth by the IPCC in its Fifth Assessment report, which expresses the temperature change at the end of the period due to either gas. The 100-y GTP of methane is 7.5, its 50-y GTP 13.2.
[2] “Green blue” is turquoise, but the term has been pre-empted for a different combination of green power and natural gas – the pyrolysis of methane or “methane splitting”.
