Hydrogen Council publishes Life-Cycle Analysis of Decarbonization Pathways
By Trevor Brown on February 04, 2021
The Hydrogen Council has published a valuable report with a rigorous life-cycle assessment (LCA) of greenhouse gas emissions from various hydrogen applications. It illustrates the report with eight specific examples, two of which focus on ammonia.
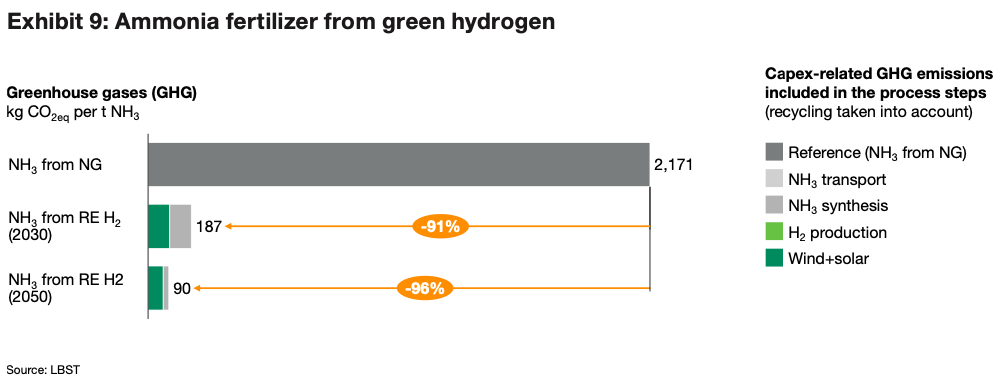
With green hydrogen as an input to ammonia used in fertilizer production, we could deliver a 96% reduction in emissions (90 kgCO2eq/tonNH3 in 2050, compared to 2,171 kgCO2eq/tonNH3 today).
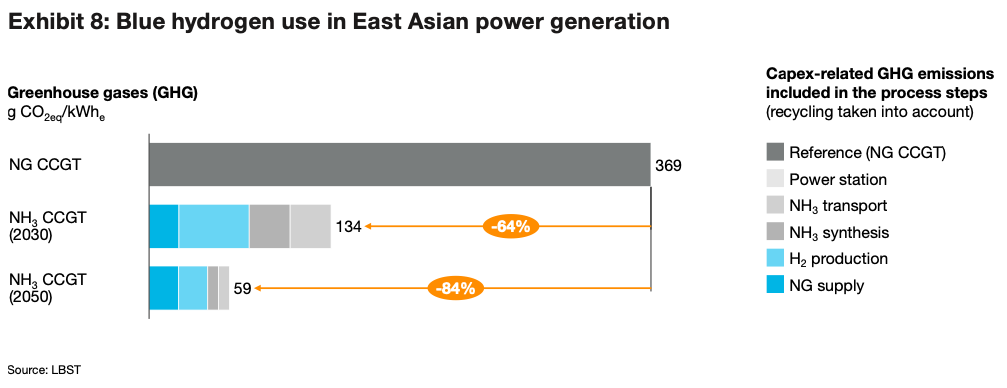
With blue hydrogen exported and combusted as ammonia for electric power generation, we could deliver an 84% reduction in emissions (59 gCO2eq/KWhe, compared to 369 gCO2eq/KWhe using natural gas today).
As the report states at the start: “Life-cycle emissions are coming into focus with scaling-up of hydrogen … To deliver on the sustainability promise, it is … not only important to make it economically viable, but also maximize its decarbonization potential.”
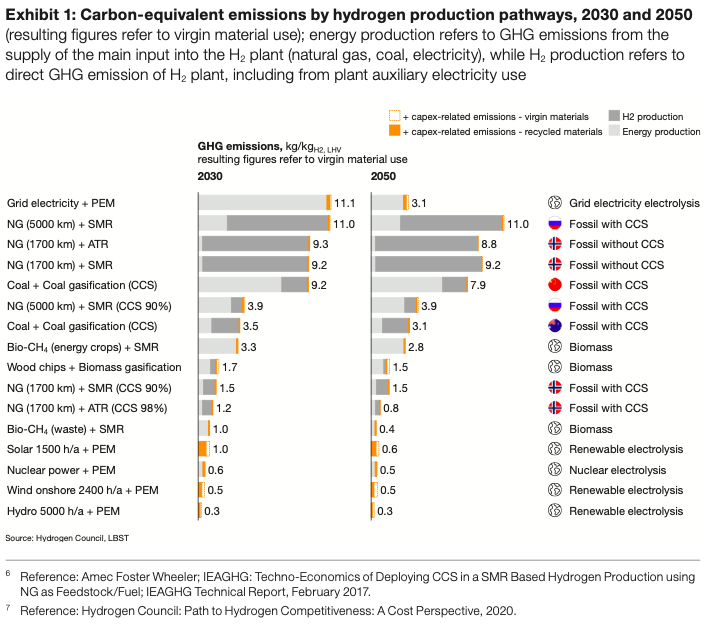
Electrolysis can achieve very low emissions if powered with renewable energy or nuclear power. Solar power achieves 1.0 kg CO2eq/kg H2 and wind 0.5 kg CO2eq/kg H2 in 2030, the difference resulting from the higher embedded capex emissions for solar panels (due to global grid mix assumed for the panel manufacture). Electrolysis with run-of-river hydropower can achieve even lower emissions of 0.3 kg CO2eq/kg H2. Nuclear power comes in at 0.6 kg CO2eq/kg H2, but it is also important to note in this context that it leads to 0.115 g of radioactive waste per kg of hydrogen …
In a world striving for low to net carbon-negative emissions, recycling plays an important role in the context of a circular economy with a sensitivity towards additional sustainability aspects, such as resource consumption (abiotic depletion), i.e., the use of resources that are nonrenewable in human- relevant timeframes.
Hydrogen Council, Hydrogen decarbonization pathways: A life-cycle assessment, January 2021
Specific pathways to illustrate life-cycle emissions
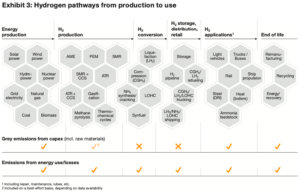
The report presents a grid of energy inputs, production and distribution technologies, and end-use applications, each with GHG emissions defined for three time periods: today, 2030, and 2050.
From this matrix, specific pathways can be examined to derive the life-cycle emissions of any number of applications, and the emission reduction potential from today to 2050.
The GHG emissions (carbon intensity) of each individual brick has been calculated, parameterized in key aspects such as the capacity rate (renewable power production) or shipping distances
Hydrogen Council, Hydrogen decarbonization pathways: A life-cycle assessment, January 2021
(H2 transport), and compiled in a simplified LCA tool. This tool also comprises the eight illustrative pathways laid out in this report as default data, including key assumptions. The simplified LCA tool allows the footprint of hundreds of different pathways to be estimated.
Of the eight pathways illustrated in the report, two are based on the conversion of hydrogen into ammonia.
LCA of power generation from ‘blue’ ammonia
One of these illustrations focuses on the use of ammonia as an energy carrier and examines a specific pathway that we write about frequently here: ammonia produced in the Middle East, using natural with carbon emissions sequestered, and shipped 12,000 kilometers to be combusted in a power plant to produce grid electricity.
There are a few interesting notes here.
First, the hydrogen production technology chosen for this illustration is ATR (auto-thermal reforming) not the more conventional SMR (steam methane reforming). This has a significant implication for the LCA outcome: you can capture (economically) more of the CO2 from ATR than from SMR (in their assumptions, this is 98% vs. 90% respectively, see Exhibit 1 above).
Second, “the CO2 is injected into old underground gas sources for permanent storage” in Saudi Arabia. This is quite different from (and much more credible than) other projects we’ve seen proposed, like the Saudi Arabia-to-Japan “blue ammonia” export demonstration, which included no permanent carbon sequestration but, rather, carbon utilization: in EOR (enhanced oil recovery) and methanol production.
Third, while the report doesn’t specifically perform any LCA on the use of ammonia as a shipping fuel (it does illustrate the use of hydrogen as a shipping fuel), this pathway assumes that the export of ammonia, across 12,000 kilometers, would be performed by an ammonia-powered gas carrier. “The ammonia is transported in refrigerated vessels that use dedicated ammonia for propulsion (boil-off gas to the extent available).” Not only is ammonia decarbonizing the end-use, but it is also decarbonizing the supply chain.
LCA of fertilizer from renewable hydrogen
The other pathway that focuses on ammonia illustrates the evolution of conventional commodity fertilizer, in which ammonia is produced in the United States and shipped 2,000 kilometers “via inland navigation” (this presumably refers to barges going up the Mississippi River from Louisiana). In this illustration, however, the production feedstock is not natural gas but a centralized (ie, large-scale) electrolyzer fed by wind and solar energy.
