IEA Analysis: Green Chinese P2A Could Compete with Brown NH3
By Stephen H. Crolius on February 28, 2019
Almost two years ago the International Energy Agency advanced the proposition that hydrogen produced using photovoltaic and wind electricity – the main constituents of the category of variable renewable electricity (VRE) – could foreseeably compete on cost with hydrogen conventionally produced via reforming of natural gas. (Ammonia Energy first reported on this work in a contemporaneous post in 2017.) A key element of the IEA’s proposition is managing resource intermittency by siting hydrogen facilities where VRE resources have complementary daily and seasonal production profiles. As it happens, many of the sites that fit this criterion are remote from large energy markets. This circumstance adds transport cost to the equation as a significant factor – and brings ammonia into play as the most practical and affordable hydrogen carrier.
The IEA has since developed a rigorous economic model to examine every aspect of its “VRE-stacking” proposition. Last month, IEA Senior Analyst Cédric Philibert, the originator of the stacking concept, shared modeling results from selected sites in China with an audience at the Energy Research Institute in Beijing. (According to a related website, the Energy Research Institute is “a national research organization conducting comprehensive studies on China’s energy issues.”) The presentation material included preliminary numbers and has not been released to the public.
The IEA exercise offers a first quantitative look at two important questions. First, what is the economic impact of VRE stacking? And second, what is the relative cost position of ammonia produced via a stacking approach? In a series of conversations with Ammonia Energy, Philibert and his colleague IEA Consultant Julien Armijo described their efforts to address these questions and the answers that are emerging.
The China Study
Certain zones in northern and western China have been noted for the quality of their wind and solar resources. According to Armijo, he and Philibert started their Chinese study by choosing a handful of locations where either the solar or wind resource is “excellent,” and the other is at least “good.” The analysis consisted of three phases: calculation of the levelized cost of electricity (LCOE) — which takes into account both capital and operating costs — generated from renewable resources; the levelized cost of hydrogen (LCOH) produced by routing the electricity through electrolyzers; and the levelized cost of ammonia (LCOA) produced by using the hydrogen as a feedstock for a Haber-Bosch synthesis loop. To a large degree, the key challenge in the work was to determine for a given electrolyzer size the optimal scale of the wind, solar, and Haber-Bosch plants based on the absolute value and variability across time of outputs from wind and solar plants.
The model assumes that solar generation is produced by photovoltaic arrays with single-axis tracking. The modeled LCOE for 2020 from these facilities ranges across the locations from $21 to $30 per MWh. Wind generation is assumed to come from Vestas wind machines that are sized in accordance with prevailing wind strengths. The modeled LCOE from these facilities ranges from $28 to $46 per MWh.
Both solar and wind resources have characteristic output patterns over the course of a day and also meteorological and seasonal fluctuations over longer periods. The IEA team considered each pertinent time scale as they calculated the optimal size, for a given electrolyzer, of the solar and wind plants at each location. At one extreme, the relationship could be set so that the electrolysis plant could accept all of the electricity generated during the sunniest and/or the windiest hour of the year. This would lead to zero curtailment (intentional limiting of generator output) but leave the plant’s expensive assets under-utilized most of the time. At the other extreme, the plant could be sized so that it would be fully utilized during the generation peak of an average day. This would lead to relatively high plant utilization but would fail to take advantage of many MWhs of potential electrical output.
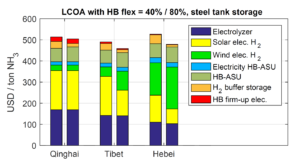
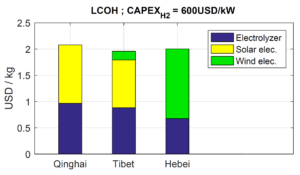
The IEA team developed an algorithm that calculates LCOH as the amount of respective solar and wind power capacities change relative to the capacity of the electrolyzer. This allows identification of the values at which each element in the system is optimized relative to the others. For the Tibet model, the result was an electrolyzer plant with 41% capacity utilization and total curtailment of solar and wind generation of only 2%. Hydrogen produced under this scenario had a levelized cost of USD$1.96 per kg. (A kg of hydrogen has approximately the same energy content as a gallon – 3.8 liters – of petrol.)
The IEA team employed a similar approach for determining the optimal size of the Haber-Bosch plant. The goal in this case is to optimize the scale of the plant given the highly variable nature of hydrogen output over time. Two expedients were included to manage the variability. The first is inclusion of hydrogen buffer storage between the electrolyzers and the Haber-Bosch plant. With a large enough hydrogen buffer, the synthesis loop could run at a constant, fully loaded rate. The argument against this approach is that storage equipment for hydrogen is expensive. The second expedient is an assumption of “increased flexibility” for the Haber-Bosch plant. “Standard Haber-Bosch flexibility” is assumed to be an operating range of 60% to 100% of nameplate capacity, while “increased flexibility” would extend the range to 20% to 100% of nameplate capacity.

The IEA algorithm was set up to calculate the required amount of buffer storage for each combination of solar, wind, and Haber-Bosch capacity values (and standard vs. increased Haber-Bosch flexibility). It turns out that the optimal values are very sensitive to site-specific profiles of solar and wind resources. In Tibet, which has robust solar resources and strong but highly seasonal winds, one obvious approach would be to build a relatively large solar farm and small wind farm. This does in fact lead to the lowest LCOA if the Haber-Bosch plant has standard flexibility. However, configuring the plant for increased flexibility allows an increase in the size of the wind farm and the proportion of electricity it contributes. During periods when the sun is not shining and the wind is not blowing, ammonia production can be turned down to its lowest level and maintained with hydrogen coming from the relatively modest buffer storage. In the standard flexibility scenario, hydrogen storage of 0.9 days of full load electrolyzer production was required. This leads to an LCOA of USD$490 per tonne of ammonia. With increased flexibility, the hydrogen storage can be reduced to 0.4 days, netting an LCOA of USD$459 per tonne, a 6% improvement.
Conclusions
The IEA model shows that VRE stacking can provide a significant economic boost, reducing the LCOA relative to that of a plant served by a single renewable generating resource by up to 10% in the case of increased Haber-Bosch flexibility, and up to 20% for standard flexibility. It should be emphasized that the capital invested in the complementary generating system is fully accounted for in the LCOA calculation, which means that the return on investment for a complete project will be unambiguously higher in the stacked scenario.
In terms of the cost position for green ammonia produced with the stacked VRE approach, the news is encouraging. According to Philibert, the USD$459 per tonne calculated in the IEA model can be compared with the cost of Chinese ammonia produced from coal whose cost is “currently assessed at USD$380 to USD$410 per tonne by our CNREC colleagues.” (CNREC stands for the China National Renewable Energy Centre, which, according to its website, is “the national institution for assisting China’s energy authorities in renewable energy (RE) policy research, and industrial management and coordination.”)
So if brown ammonia goes to market at a price of, say, USD$450 per tonne (~15% markup over cost), and green ammonia could be available at a price of USD$530 per tonne, what effect might this have on national policy calculus? It’s one thing if the price of a green commodity is twice that of a brown one. But just 18% more? This could be a bargain policy-makers may be willing to strike. Philibert’s thinking, in any case, runs along these lines. “Green ammonia from the selected sites could possibly serve economic centers in eastern China under a policy-driven carbon-reduction regime,” he said, “primarily for its current industrial uses, notably the production of nitrogen fertilisers.”
It is tempting to imagine a future in which green ammonia is established as a staple energy commodity. But the first step on the path to that vision is the emergence of market demand for the green commodity at a price both sellers and buyers can support. The IEA’s China analysis points to a case where the economic fundamentals could support exactly this outcome.
Cameo image courtesy of howstuffworks.com.
